

 KEY STAGE THREE
  Information HomeTask Information
Task 7
Now that you have created your graph have a careful look at what it is telling you.
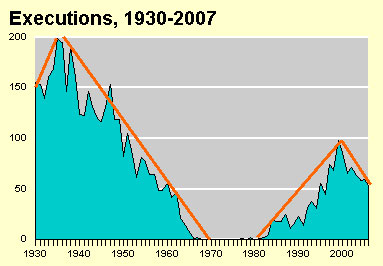 Have the numbers increased or decreased over time?
Is it becoming more/less popular over time?
Are the numbers changing because it is becoming more socially acceptable?
Try to think of a reason for the changes in the data that you can see.
Write your findings down as you will need to use these later.
Based on the trend that you can see in your graph make a prediction about what you think will happen to the numbers next year, the year after and in maybe 5 years time. Write this down.
Copyright © www.teach-ict.com