

 KEY STAGE THREE
  Information HomeTask Information
Task 4
Using appropriate software create graphs to show the opinions of the younger group of people that you surveyed. 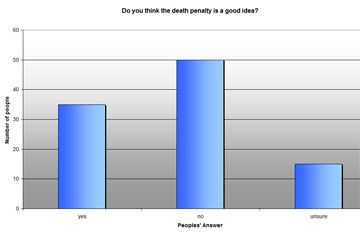
Make sure every graph has an appropriate title and that axis are labelled. Remove the legend if it isn’t needed.
Once you have completed these graphs create a second set to show the results from the older group of people that you surveyed.
Now create another graph that puts the data from both the younger group and older group onto the same graph. This should make it easier to compare your results.
If you don’t know how to do this ask your teacher.
Copyright © www.teach-ict.com