 A LEVEL COMPUTING
 UML DIAGRAMS
  Theory
14. Activity diagram
An activity diagram is another kind of behaviour diagram. In this case it is showing the activities needed to get from an input condition in the system to an end condition or output. The diagram runs horizontally to show time-order.
For example an order processing system begins with the arrival of an order. A number of activities ensue and the output is a fully processed order.
Activities can be sequential, parallel or a mixture of both. Branching may occur at decision points. Activity diagrams are somewhat similar to flow diagrams but they follow the conventions of the UML specification.
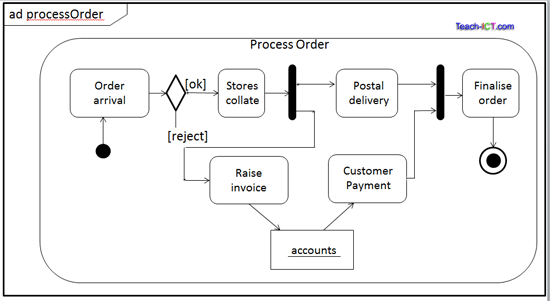
The specification includes a fair number of graphical elements. The example below shows some of the more common ones

The element you see in this example are
- Activity diagram. Shown as a bounded box with a rounded rectangle within it.
- A header 'ad processOrder' that identifies the diagram
- Rounded rectangles are individual activities
- Arrows indicate flow
- Thick bars are 'join' or 'merge' nodes' where an incoming flow splits into two different flows or vice versa.
- The solid circle shows the start of the activity
- Like flow diagrams, a diamond is a decision point
- The bulls eye shows the end point of the activity
- The rectangle 'accounts' with an underline is a datastore
Challenge see if you can find out one extra fact on this topic that we haven't already told you
Click on this link: UML activity diagram
Copyright © www.teach-ict.com

