
 A LEVEL COMPUTING
 ANALYSIS THEORY
4. Data Flow Diagrams
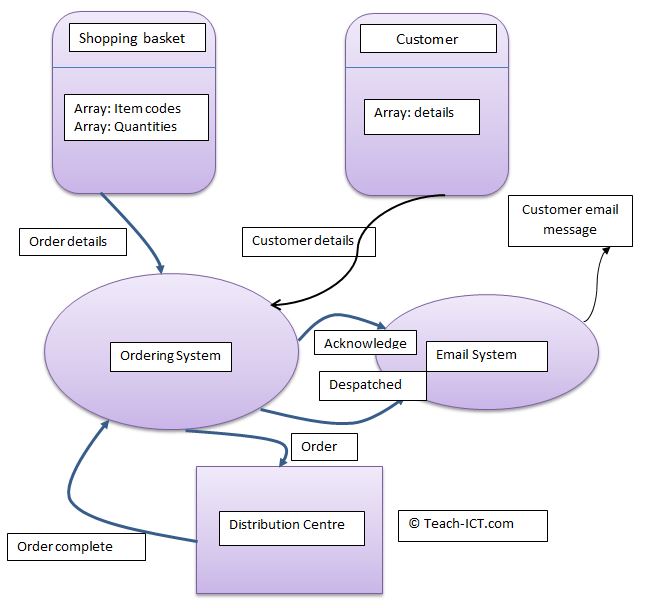
A data flow diagram is created to show how information flows from an input to an outcome (not always an output, as there may be many outputs, such as the parcels being delivered and an email being sent).
For example you could consider how information flows from an online shop's shopping basket to the items being physically despatched.
The diagram above has been deliberately created as a combination of simple and complex DFD, It would never be produced in a real situation because it addresses a different audience at each level.
The first level sees a rounded rectangle with a line drawn down across it. 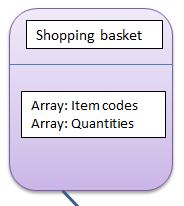 The upper part describes the software class and the lower part describes some key data structures to do with the data being held. This is the kind of thinking that goes on with designing a software system at the design stage. However, it is included here to show that DFDs can be very detailed or quite generic.
The DFD at that level effectivelty describes what the coders need to do, which is why a DFD at this complexity needs an expert.
The next region is a bit generic such as 'ordering system' and 'email system'. So wth this level of DFD it is mainly looking towards the management side of things. Software coders have no additional information with this kind of DFD, but management now understand what the system needs to do in general terms.
A good requirements document would have both kinds of Data Flow Diagrams (DFD)
Challenge see if you can find out one extra fact on this topic that we haven't already told you
Click on this link: Data Flow Diagram
Copyright © www.teach-ict.com