4. Features of spreadsheets for modelling
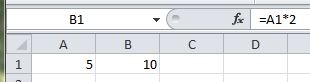
Formulas
If a value on a spreadsheet is changed, formulas make sure that the change is updated throughout the rest of the spreadsheet.
Goal Seek
This looks at the end point and works backwards. For example, "I want to make £10,000 profit this month. How many items do I need to sell?". The Goal Seek tool will give you that answer.
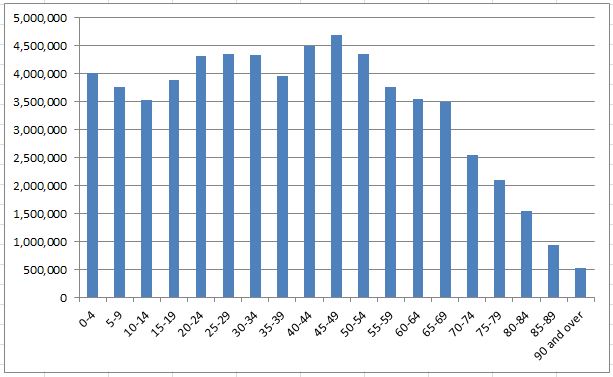
Graphs and Charts
Graphs and charts let you present the data in a visual or pictoral form. Humans find it easier to spot trends and analyse data in a graph rather than in a table of numbers.
Regression Analysis
This is using mathematical tools available in the spreadsheet to look for trends. This can help you see relationships between things such as on a hot day, you will sell more ice creams, or when it is wet, umbrella sales will rise.
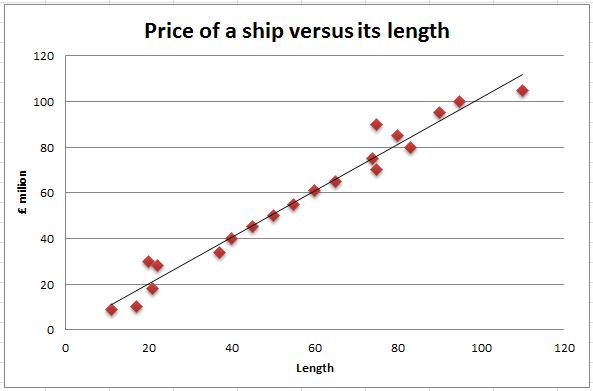
Regression analysis can be used to help predict future profits based on the profits you have already made. It can look at the profit you made during the last six months and predict ahead to the next six months based on the data.
Challenge see if you can find out one extra fact on this topic that we haven't already told you
Click on this link: Charts and Graphs